 Data Studies


What effects did the forest fires have on physical activity in the West Coast? We dove into the data and found drift smoke disrupted people’s workouts and overall activity.
Fires have raged throughout California, Washington, Oregon, Nevada, and other states in the West Coast. On August 18, California Governor Gavin Newsom declared a state of emergency, and on August 20 it was reported that Northern California had the worst air in the world. As thousands of acres of land and property burn, fine particulate matter (PM2.5) has been released from combusting carbon, household items, and other materials. Beyond reducing visibility and creating orange sunsets, PM2.5 can infiltrate people’s lungs. Consequently, the human body responds by sending out immune cells to fight these invaders, but unlike viruses or bacteria, PM2.5 materials cannot be broken down by the immune system, so a prolonged inflammation is unleashed that can affect the lungs, brain, liver, and kidneys.
But did residents in affected areas generally change their habits as the presence of PM2.5 created by these forest fires increased in cities?
Yes, for the most part.
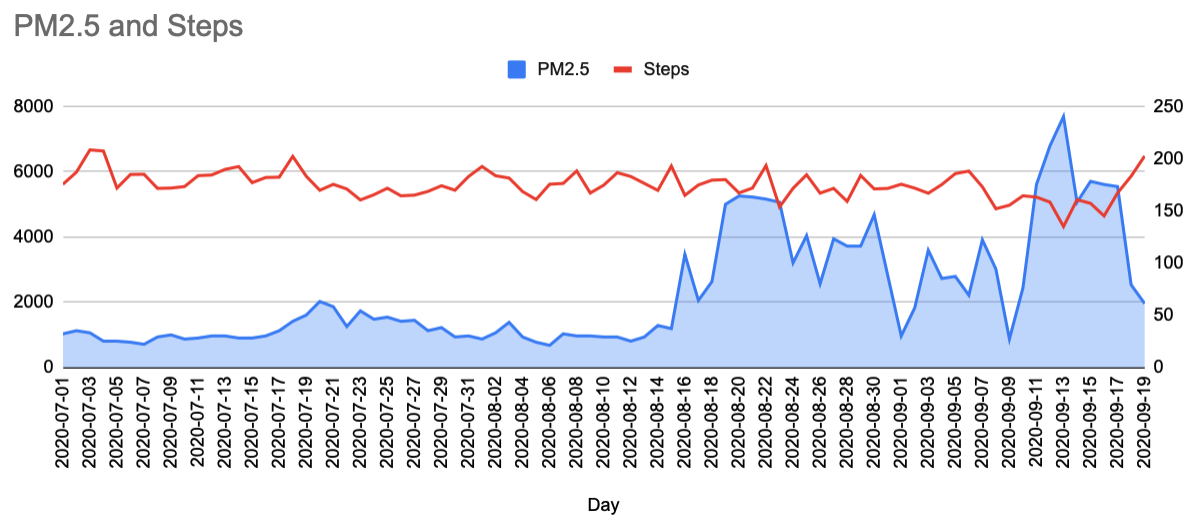
Withings compiled data from our community’s wearables and apps to compare recorded steps with daily PM2.5 readings in affected cities from the Environmental Protection Agency’s (EPA) Air Quality Index (AQI).
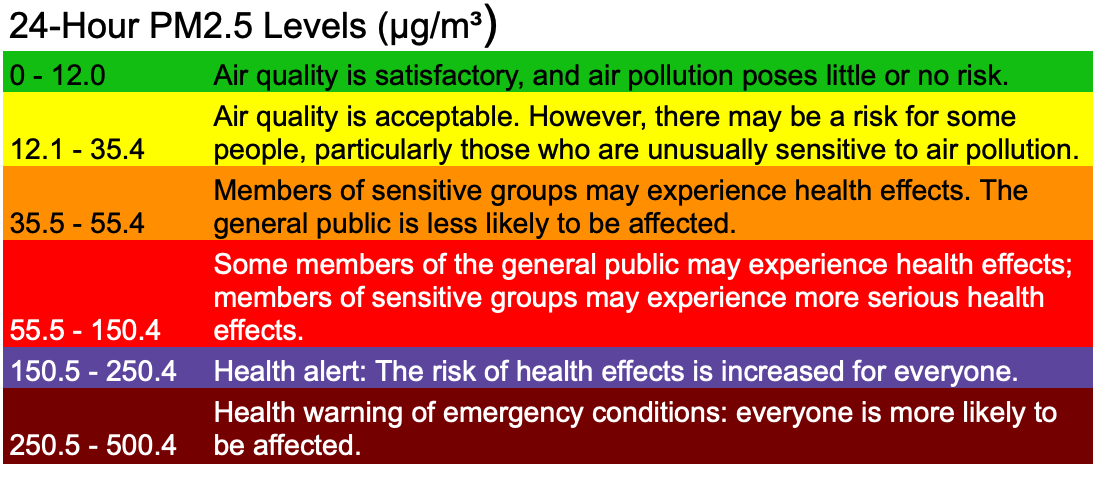
Understanding which PM2.5 levels are considered safe by the EPA is important in reading the effects the forest fires had on the population. Levels of PM2.5 between 0 – 12 are considered “Good” and pose “little to no risk” to any group, according to the EPA. However, from August 18 to September 19, the West Coast saw PM2.5 levels jump several notches, from “Unhealthy” (55.5 – 150.4) to “Very unhealthy” (150.5 – 250.4) and to the EPA’s highest “Hazardous” warning (250.5 – 500.4).
 AirNow.gov“/>
Calculating the fire’s effects on physical activity
Withings defined the dates of July 1 to August 18 as the “baseline” or unaffected time, while August 19 to September 19 is considered the timespan where fires began impacting the West Coast. In addition, Withings used anonymous aggregated data collected from about 20,000 community members across several cities and areas, including the Bay Area, Los Angeles, San Diego, Sacramento, Reno, Eugene, Portland, and Seattle.
The big picture
The above cities combined had a baseline average of 5,431 daily steps before the fires, which was then reduced by 3.26% to 5,254 steps over the month.
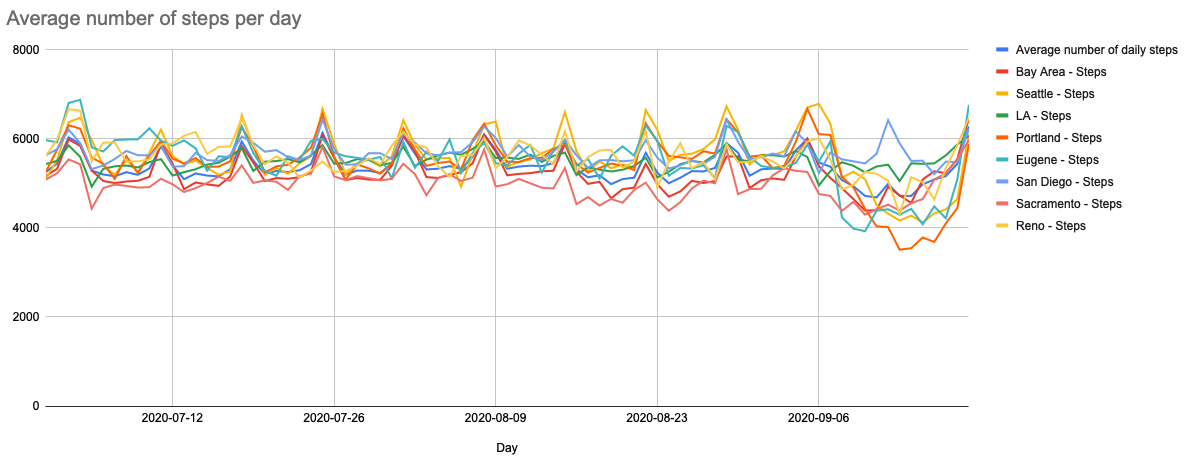
However, not every city experienced the same drops in physical activity. The data show that certain PM2.5 thresholds had to be met before physical behavior experienced drastic changes, with Portland, Seattle, Eugene and Reno demonstrating the largest decreases in steps.
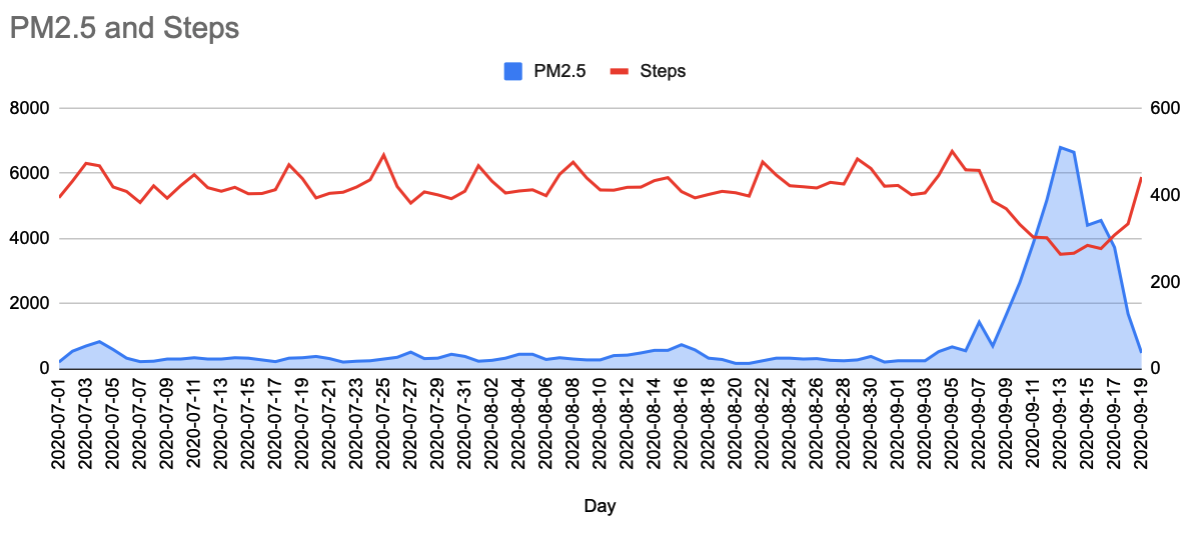
Portland
“It looks as though a bomb went off,” Detroit, OR, resident Elizabeth Smith said when asked to describe the fire-torn town just one-and-a-half hours away from Portland. Although most of the fires are burning in rural areas, that smoke brings PM2.5 to bigger cities like Portland, and this traveling particulate matter was shown to have caused a decrease in physical activity for those living in the city.
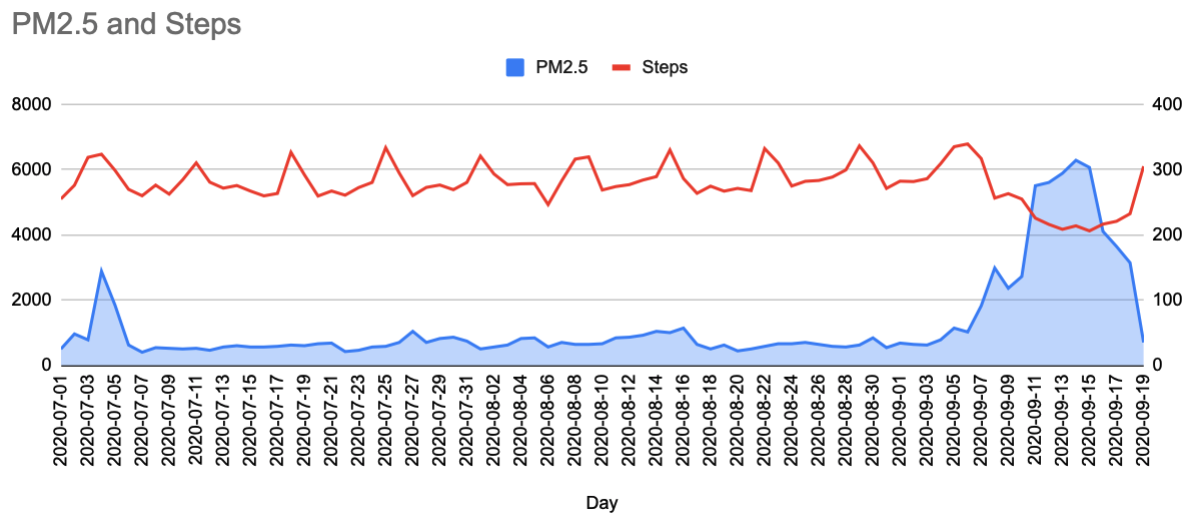
Seattle
Washington State suffered from a variety of burnings including the Babb, Manning Road, Evans Canyon, Customs Road, Jungle Creek, and Chikamin fires that resulted in more than 810,000 acres of decimated land. The particulate matter from these plus multiple other fires contributed to PM2.5 levels over 300.
Eugene
Another Oregon town experienced high levels of PM2.5. Clean air shelters were opened even in Eugene to help vulnerable people experiencing homelessness, as a combination of smoke and fog created almost zero visibility in the county. The EPA’s AQI data was not available for Eugene to display a visual. Regardless, the community’s fitness activity in Eugene still showed a significant decrease due to smoke.
-
Baseline average: 5,721 steps
-
Decreased to: 5,212 steps
-
8.91% decrease on average
-
However, on the 15th of September, Eugene experienced its worst drop of 28.74% to 4,077 steps (PM2.5 unknown)
Reno
Multiple fires from California drifted into Nevada, bringing high PM2.5 levels. Although Reno had been experiencing drift smoke throughout August, steps seemed to decrease further into September once particulate matter had a more sustained presence and reached levels above 150. Over 2 million acres have burned in California this season, and that has had an impact on physical activity in Nevada.
Cities and regions including the Bay Area, Los Angeles, San Diego, and Sacramento also experienced drops in physical activity, but the overall decrease is less compared to the above cities due to lower PM2.5 levels:
Bay Area:
218 PM2.5, -17.37%, Sept 11
Sacramento
200 PM2.5, -12.73%, Sept 11
207 PM2.5,-13.35%, Sept 13
San Diego:
157 PM2.5, -3.44%, Sept 15
146 PM2.5,-3.53%, Sept 14
Los Angeles
199 PM2.5, -2.33% Sept 11
165 PM2.5, -8.29%, Sept 13
Notice that in Los Angeles, on the day with their worst particulate matter levels, they did not necessarily experience the biggest drop in physical activity. We at Withings don’t know why the unhealthy PM2.5 levels did not show a larger decrease. However we asked Los Angeles-based writer and comedian Andrés du Bouchet to speculate, and he said, “We didn’t notice the air because it wasn’t complimenting us. But seriously, maybe the simplest explanation? We’re used to crappy air quality!”
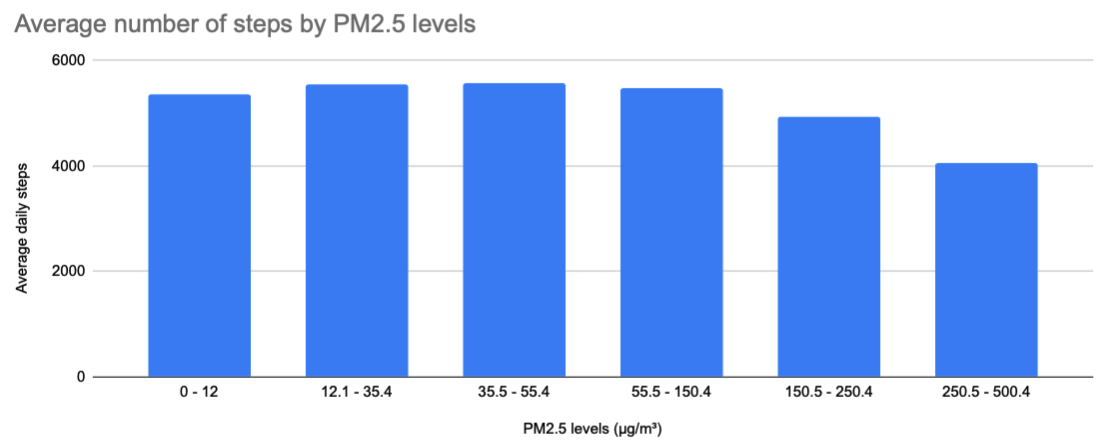
Certain PM2.5 thresholds decrease human activity
Regardless of differences in cities, there is a certain particulate matter level that almost universally affects human activity. Between PM2.5 levels of 55.5-150.4 and 150.5-250.4, there is a 9% decrease in average daily steps. However, the largest decrease in steps occurs between 150.5-250.4 and 250.5-500.4, with a 16% drop.
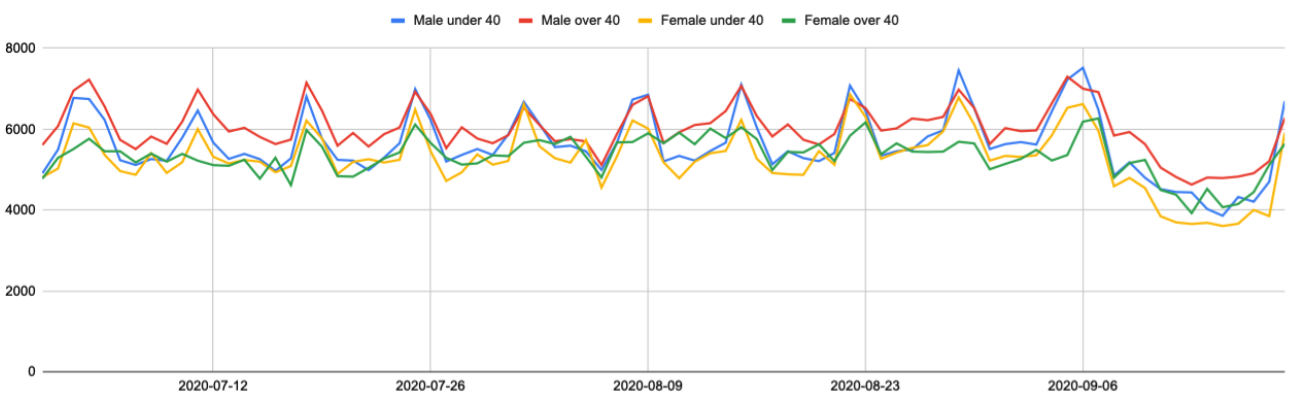
Were certain age or gender groups more likely to maintain physical activity throughout the height of the fires?
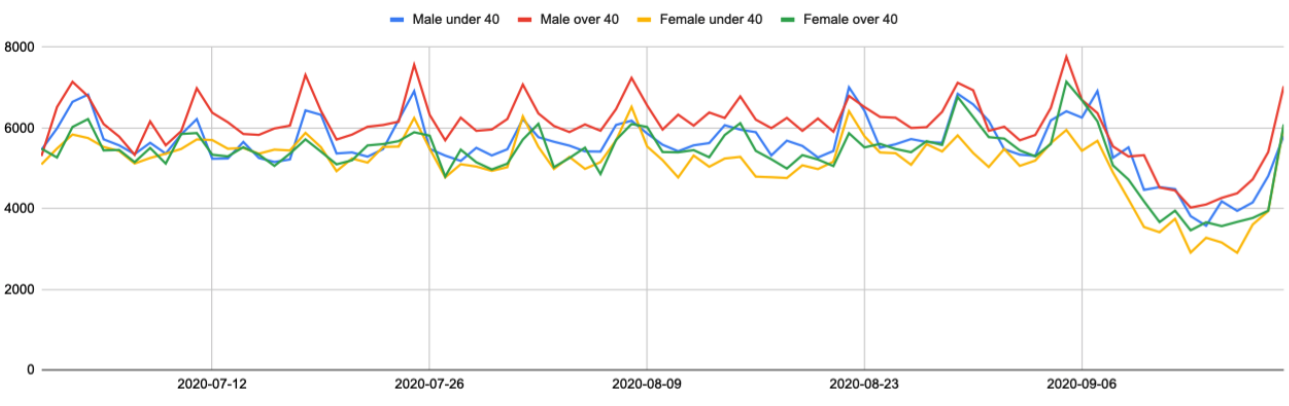
Throughout the report, it’s been shown that certain PM2.5 thresholds had to be met in order to cause any drastic behavioral change in physical activity. The level of PM2.5 in cities like Seattle (314 PM2.5) and Portland (509 PM2.5) from September 11 through September 17 met those thresholds, and when those levels were reached, there was a dip in all physical activity for every age and gender group.
Seattle
Portland
Logged outdoor activities decreased substantially
Counting decreases in steps is valuable, but communities also showed that intentional outdoor workouts such as running and cycling also decreased. Cities like Sacramento saw almost a halving of outdoor workouts.
Sacramento: -48.33%
Bay Area: -34.17%
Eugene: -31.32%
Portland: -31.01%
Seattle: -27.38%
Reno: -23.81%
Los Angeles: -20.72%
San Diego: -19.97%
But did people increase their indoor workouts to compensate?
No! In fact community members decreased their indoor workouts throughout the fires. Indoor workouts include weight lifting, pilates, yoga, ellipticals, running, and cycling. The pandemic most certainly contributes to indoor decreases, as many gyms are either closed or have restricted limits.
Reno: -25.76%
Eugene: -22.63%
San Diego: -7.48%
Seattle: -6.25%
Bay Area: -4.14%
Portland: -2.79%
Los Angeles: -1.00%
Sacramento: -0.61%
Was sleep affected by the fires?
After measuring heart rate, respiratory rate, and other sleep scores across all cities throughout nighttime hours, it was determined that sleep quality was not affected by the fires. However, we assume that most members of our community sleep indoors and not outside at night.
Conclusions
Forest fires and their accompanying increase in PM2.5 levels had noticeable effects on physical activity throughout the West Coast. In general, people reduced their activity levels in the presence of a certain PM2.5 threshold, and physical activity in the form of intentional workouts also experienced a decrease in the outdoors and indoors. No particular gender or age group was more likely to maintain activity throughout the height of the fires, but certain cities reacted more strongly than others when approaching specific PM2.5 levels.
Methodology
This study was conducted by Withings analyzing the anonymous aggregated data from about 20,000 users, with at least 200 in each area. To create the data around the wildfires time period for each area, Withings set the start date to August 19, 2020, until September 19, 2020. The wildfire data was compared to aggregated data from July 1, 2020, to August 18, 2020.
Withings guarantees the confidentiality of personal data and protects the privacy of all its users. Therefore, all data used for this study was rigorously anonymized and aggregated in order to avoid any re-identification.
Header image: September 10, 2020, on Hollywood Blvd. in Los Angeles, California (GettyImages)